Tables and trend lines by topic
Adverse Childhood Experience, Pennsylvania Adults, 2021
| Before Age 18, Lived With Anyone Who Was Depressed, Mentally Ill or Suicidal* |
Before Age 18, Lived With Anyone Who Was a Problem Drinker or Alcoholic* |
Before Age 18, Lived With Anyone Who Used Illegal Street Drugs or Abused Prescriptions* |
Before Age 18, Lived With Anyone Who Was Sentenced to Serve Time in Prison* |
|||||
|---|---|---|---|---|---|---|---|---|
| Demographics | % | CI | % | CI | % | CI | % | CI |
| All adults | 22 | 21-24 | 25 | 24-27 | 13 | 12-14 | 9 | 8-10 |
| Gender | ||||||||
| Male | 20 | 18-22 | 22 | 20-24 | 13 | 11-15 | 9 | 7-10 |
| Female | 25 | 23-27 | 28 | 26-30 | 13 | 12-15 | 10 | 8-11 |
| Age | ||||||||
| 18-29 | 37 | 33-42 | 27 | 23-31 | 18 | 15-22 | 16 | 13-19 |
| 30-44 | 30 | 27-34 | 27 | 24-31 | 20 | 17-24 | 14 | 12-17 |
| 45-64 | 19 | 17-21 | 27 | 24-30 | 13 | 11-15 | 7 | 5-8 |
| 65+ | 10 | 8-12 | 21 | 18-24 | 4 | 3-6 | 3 | 2-4 |
| Education | ||||||||
| < High school | 20 | 13-27 | 33 | 24-42 | 21 | 15-29 | 15 | 11-22 |
| High school | 22 | 20-25 | 28 | 25-31 | 15 | 12-17 | 11 | 9-13 |
| Some college | 24 | 21-27 | 26 | 24-29 | 13 | 11-15 | 9 | 7-11 |
| College degree | 22 | 20-25 | 19 | 17-22 | 10 | 8-11 | 5 | 4-6 |
| Household income | ||||||||
| < $15,000 | 22 | 16-30 | 35 | 27-44 | 21 | 14-29 | 15 | 10-23 |
| $15,000 to $24,999 | 25 | 20-31 | 32 | 26-40 | 16 | 12-22 | 14 | 10-19 |
| $25,000 to $49,999 | 25 | 22-28 | 28 | 25-32 | 16 | 13-19 | 13 | 11-16 |
| $50,000 to $74,999 | 21 | 18-25 | 22 | 19-26 | 11 | 9-14 | 7 | 6-10 |
| $75,000+ | 23 | 20-26 | 24 | 21-27 | 12 | 10-14 | 5 | 4-7 |
| Race | ||||||||
| White, non-Hispanic | 22 | 20-23 | 25 | 23-26 | 12 | 11-13 | 7 | 6-8 |
| Black, non-Hispanic | 26 | 21-30 | 29 | 25-34 | 20 | 16-25 | 20 | 17-25 |
| Hispanic | 29 | 21-38 | 35 | 27-44 | 22 | 16-31 | 18 | 13-25 |
| Sexual orientation | ||||||||
| Lesbian, gay or bisexual | 51 | 43-59 | 34 | 27-42 | 23 | 17-30 | 18 | 13-24 |
| Straight | 20 | 19-22 | 24 | 23-26 | 12 | 11-14 | 8 | 7-10 |
*Excludes missing, don't know and refused
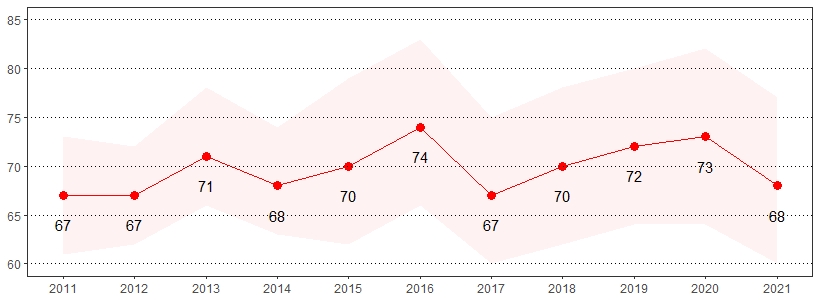
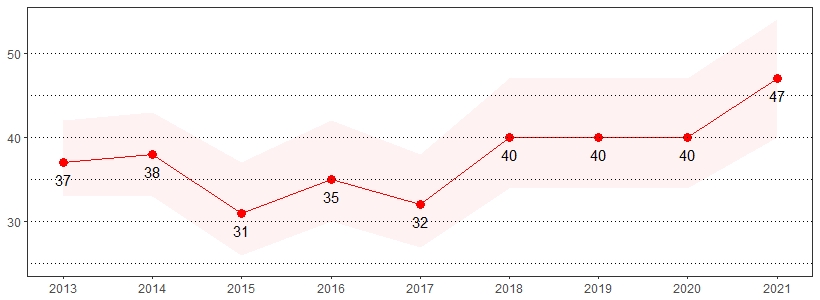
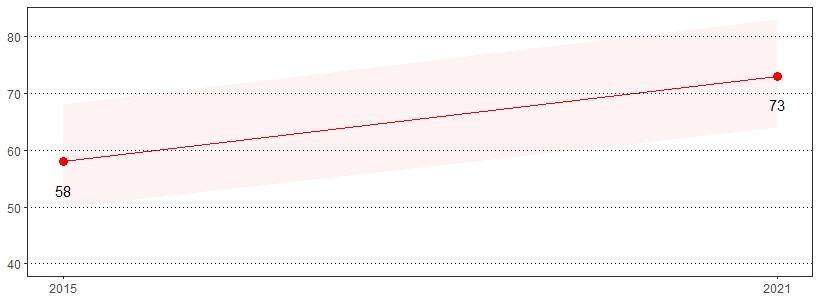
Before Age 18, Lived with Anyone Who Was Depressed, Mentally Ill or Suicidal Prevalence
per 1,000 Pennsylvania Population, Pennsylvania Adults, 2014-2021
Color shading around estimates show 95% confidence intervals
Alcohol Consumption, Pennsylvania Adults, 2021
| Binge Drinking* ** | At Risk for Problem Drinking* *** | Chronic Drinking* **** | ||||
|---|---|---|---|---|---|---|
| Demographics | % | CI | % | CI | % | CI |
| All adults | 15 | 14-17 | 7 | 6-8 | 6 | 6-7 |
| Gender | ||||||
| Male | 19 | 17-21 | 7 | 6-9 | 10 | 8-12 |
| Female | 12 | 11-14 | 6 | 5-7 | 3 | 3-4 |
| Age | ||||||
| 18-29 | 24 | 21-28 | 6 | 4-8 | 5 | 4-8 |
| 30-44 | 19 | 17-22 | 7 | 6-10 | 6 | 5-9 |
| 45-64 | 16 | 14-19 | 8 | 6-9 | 7 | 6-9 |
| 65+ | 5 | 4-6 | 5 | 4-8 | 6 | 5-9 |
| Education | ||||||
| < High school | 11 | 7-16 | 8 | 4-15 | 10 | 6-17 |
| High school | 14 | 12-17 | 6 | 5-7 | 6 | 5-8 |
| Some college | 18 | 15-20 | 8 | 7-10 | 7 | 6-9 |
| College degree | 16 | 14-18 | 6 | 5-7 | 5 | 4-6 |
| Household income | ||||||
| < $15,000 | 11 | 7-16 | 5 | 3-9 | 4 | 2-7 |
| $15,000 to $24,999 | 11 | 8-15 | 6 | 3-13 | 6 | 3-13 |
| $25,000 to $49,999 | 15 | 13-18 | 7 | 5-9 | 8 | 6-10 |
| $50,000 to $74,999 | 17 | 14-21 | 6 | 5-9 | 6 | 5-9 |
| $75,000+ | 19 | 16-21 | 8 | 7-10 | 7 | 6-9 |
| Race | ||||||
| White, non-Hispanic | 16 | 15-17 | 7 | 6-8 | 7 | 6-8 |
| Black, non-Hispanic | 15 | 12-18 | 6 | 4-8 | 5 | 3-7 |
| Hispanic | 15 | 11-20 | 6 | 3-13 | 8 | 4-15 |
| Sexual orientation | ||||||
| Lesbian, gay or bisexual | 26 | 20-33 | 9 | 6-14 | 7 | 4-10 |
| Straight | 15 | 14-16 | 6 | 6-7 | 6 | 5-7 |
*Excludes missing, don't know and refused
**Defined as having five or more drinks on one occasion for men and having four or more drinks on one occasion for women
***Defined as adult men having more than two drinks per day and adult women having more than one drink per day
****Defined as having an average of two drinks or more every day for the past 30 days
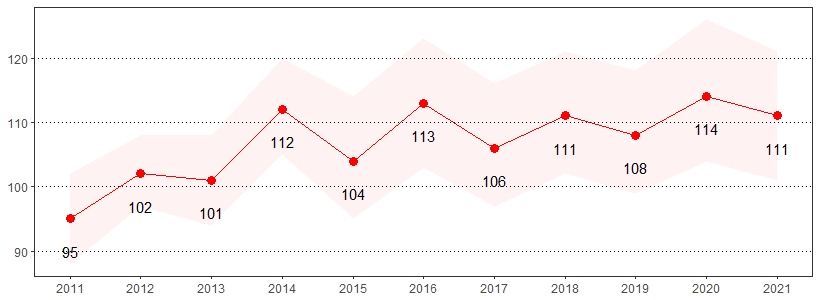
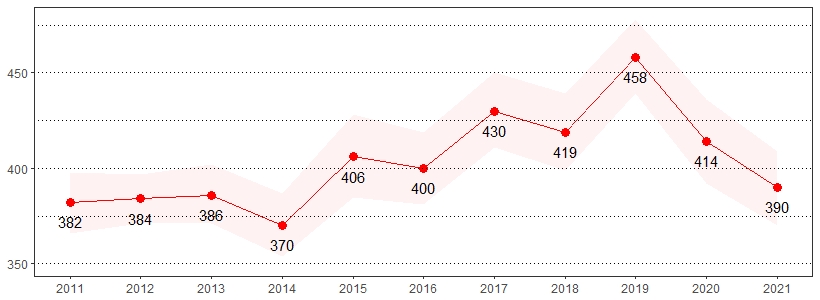
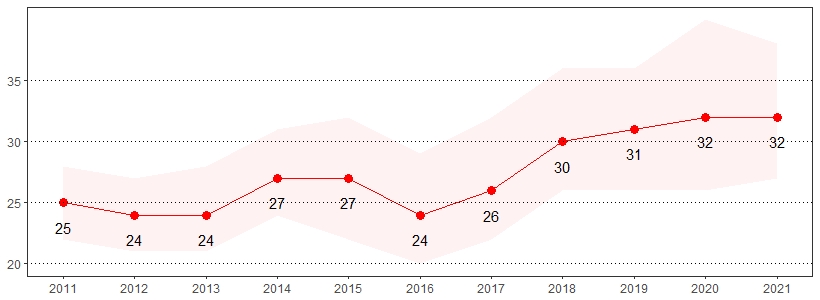
Alcohol Consumption Prevalence per 1,000 Pennsylvania Population,
Pennsylvania Adults, 2011-2021
Color bands around estimates show 95% confidence intervals
Arthritis, Pennsylvania Adults, 2021
| Ever Told Have Some Form of Arthritis* | Usual Activities Limited Due to Arthritis or Joint Symptoms* ** | Arthritis or Joint Symptoms Affected Work* ** | Taken Class to Manage Arthritis or Joint Symptoms* ** | |||||
|---|---|---|---|---|---|---|---|---|
| Demographics | % | CI | % | CI | % | CI | % | CI |
| All adults | 29 | 27-30 | 39 | 36-42 | 27 | 25-30 | 13 | 11-16 |
| Gender | ||||||||
| Male | 24 | 23-26 | 38 | 34-43 | 25 | 21-29 | 12 | 10-16 |
| Female | 33 | 31-35 | 39 | 35-43 | 29 | 25-33 | 14 | 12-17 |
| Age | ||||||||
| 18-29 | 4 | 3-7 | NSR | NSR | NSR | NSR | NSR | NSR |
| 30-44 | 13 | 11-15 | 39 | 31-48 | 37 | 30-46 | 10 | 7-16 |
| 45-64 | 35 | 32-37 | 42 | 38-47 | 35 | 31-39 | 15 | 12-19 |
| 65+ | 55 | 52-59 | 35 | 31-39 | 18 | 15-23 | 14 | 11-17 |
| Education | ||||||||
| < High school | 35 | 28-42 | 47 | 35-60 | 40 | 29-53 | 18 | 10-30 |
| High school | 32 | 29-34 | 40 | 36-45 | 29 | 25-33 | 9 | 7-12 |
| Some college | 31 | 28-33 | 40 | 35-46 | 30 | 25-35 | 15 | 11-19 |
| College degree | 22 | 20-24 | 30 | 26-35 | 15 | 12-18 | 16 | 13-20 |
| Household income | ||||||||
| < $15,000 | 47 | 39-55 | 58 | 46-70 | 52 | 40-65 | 7 | 3-13 |
| $15,000 to $24,999 | 46 | 40-52 | 58 | 48-68 | 42 | 33-51 | 18 | 11-26 |
| $25,000 to $49,999 | 33 | 30-37 | 40 | 34-47 | 30 | 24-36 | 15 | 11-20 |
| $50,000 to $74,999 | 32 | 28-36 | 37 | 30-44 | 26 | 20-33 | 18 | 12-24 |
| $75,000+ | 21 | 19-24 | 30 | 25-36 | 14 | 10-19 | 10 | 7-14 |
| Race | ||||||||
| White, non-Hispanic | 31 | 29-33 | 37 | 34-40 | 24 | 21-27 | 13 | 11-15 |
| Black, non-Hispanic | 27 | 23-31 | 51 | 42-60 | 44 | 35-53 | 16 | 11-23 |
| Hispanic | 18 | 13-23 | NSR | NSR | NSR | NSR | NSR | NSR |
| Sexual orientation | ||||||||
| Lesbian, gay or bisexual | 18 | 14-23 | NSR | NSR | NSR | NSR | 8 | 3-19 |
| Straight | 30 | 29-32 | 38 | 35-41 | 26 | 23-28 | 12 | 10-15 |
*Excludes missing, don't know and refused
Note: If "NSR" is displayed, then the total response is less than 50 and/or the percentage prevalence is considered "not statistically reliable."
**Out of adults who were told they have some form or arthritis
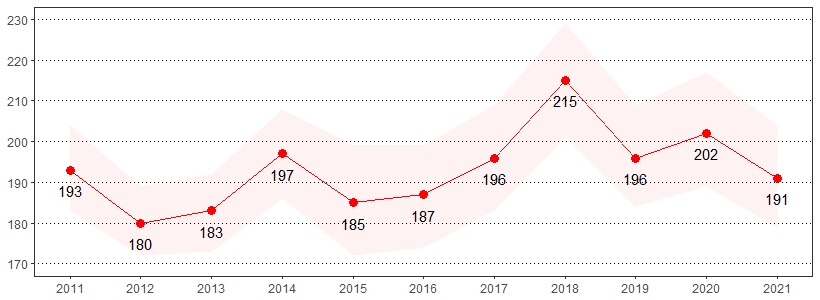
Arthritis Prevalence per 1,000 Pennsylvania Population,
Pennsylvania Adults, 2011-2021
Color shading around estimates show 95% confidence intervals
Asthma, Pennsylvania Adults, 2021
| Ever Told Have Asthma* | Currently Has Asthma* | |||
|---|---|---|---|---|
| Demographics | % | CI | % | CI |
| All adults | 15 | 14-16 | 10 | 9-11 |
| Gender | ||||
| Male | 14 | 12-15 | 8 | 7-9 |
| Female | 17 | 15-18 | 13 | 11-14 |
| Age | ||||
| 18-29 | 20 | 17-24 | 11 | 9-15 |
| 30-44 | 18 | 15-20 | 12 | 10-15 |
| 45-64 | 14 | 12-15 | 10 | 9-12 |
| 65+ | 11 | 9-13 | 8 | 6-10 |
| Education | ||||
| < High school | 21 | 15-27 | 15 | 10-21 |
| High school | 16 | 14-18 | 11 | 10-13 |
| Some college | 15 | 13-17 | 10 | 8-12 |
| College degree | 13 | 12-15 | 8 | 7-9 |
| Household income | ||||
| < $15,000 | 20 | 15-27 | 18 | 13-25 |
| $15,000 to $24,999 | 18 | 14-23 | 15 | 11-20 |
| $25,000 to $49,999 | 16 | 13-18 | 11 | 9-13 |
| $50,000 to $74,999 | 13 | 11-17 | 8 | 6-10 |
| $75,000+ | 13 | 11-14 | 8 | 6-9 |
| Race | ||||
| White, non-Hispanic | 14 | 13-16 | 10 | 8-11 |
| Black, non-Hispanic | 21 | 17-25 | 15 | 12-19 |
| Hispanic | 18 | 14-24 | 14 | 10-19 |
| Sexual orientation | ||||
| Lesbian, gay or bisexual | 28 | 22-36 | 19 | 14-27 |
| Straight | 14 | 13-16 | 10 | 9-11 |
*Excludes missing, don't know and refused
Asthma Prevalence per 1,000 Pennsylvania Population,
Pennsylvania Adults, 2011-2021
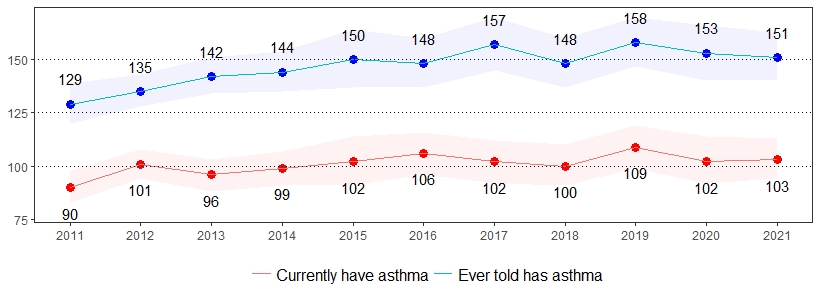
Color bands around estimates show 95% confidence intervals
Cancer, Pennsylvania Adults, 2021
| Ever Told Had Skin Cancer* | Ever Told Had Any Other Type of Cancer* |
|||
|---|---|---|---|---|
| Demographics | % | CI | % | CI |
| All adults | 6 | 6-7 | 8 | 7-9 |
| Gender | ||||
| Male | 7 | 6-8 | 6 | 5-7 |
| Female | 6 | 5-7 | 10 | 9-11 |
| Age | ||||
| 18-29 | 0 | 0-1 | 1 | 0-3 |
| 30-44 | 1 | 1-2 | 2 | 1-3 |
| 45-64 | 6 | 5-7 | 8 | 7-10 |
| 65+ | 16 | 14-19 | 19 | 17-22 |
| Education | ||||
| < High school | 5 | 2-10 | 10 | 6-15 |
| High school | 6 | 5-7 | 9 | 8-11 |
| Some college | 7 | 5-9 | 8 | 6-9 |
| College degree | 7 | 6-8 | 6 | 5-7 |
| Household income | ||||
| < $15,000 | 5 | 2-11 | 15 | 8-24 |
| $15,000 to $24,999 | 7 | 4-11 | 9 | 7-13 |
| $25,000 to $49,999 | 7 | 6-10 | 9 | 8-12 |
| $50,000 to $74,999 | 9 | 6-11 | 8 | 6-11 |
| $75,000+ | 6 | 5-7 | 6 | 5-7 |
| Race | ||||
| White, non-Hispanic | 8 | 7-9 | 9 | 8-10 |
| Black, non-Hispanic | 0 | 0-1 | 8 | 6-11 |
| Hispanic | 1 | 0-4 | 2 | 1-5 |
| Sexual orientation | ||||
| Lesbian, gay or bisexual | 2 | 1-4 | 3 | 1-6 |
| Straight | 7 | 6-8 | 8 | 7-9 |
*Excludes missing, don't know and refused
Cancer Prevalence per 1,000 Pennsylvania Population,
Pennsylvania Adults, 2011-2021
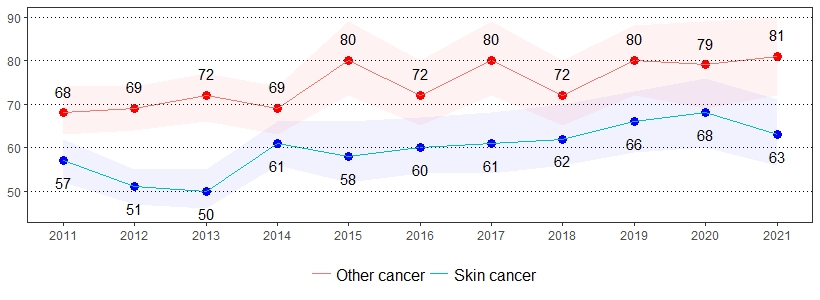
Color bands around estimates show 95% confidence intervals
Cardiovascular Disease, Pennsylvania Adults, Age 35+, 2021
| Ever Told Had Heart Attack, Heart Disease or Stroke* | Ever Told They Had a Heart Attack* | Ever Told They Had Angina or Heart Disease* | Ever Told They Had a Stroke* | |||||
|---|---|---|---|---|---|---|---|---|
| Demographics | % | CI | % | CI | % | CI | % | CI |
| All adults | 13 | 12-14 | 7 | 6-8 | 6 | 5-7 | 5 | 4-6 |
| Gender | ||||||||
| Male | 16 | 15-19 | 9 | 8-11 | 8 | 7-10 | 5 | 4-7 |
| Female | 10 | 9-12 | 4 | 3-5 | 4 | 3-6 | 5 | 4-7 |
| Age | ||||||||
| 35-44 | 3 | 2-5 | 1 | 1-2 | 1 | 1-2 | 2 | 1-4 |
| 45-54 | 8 | 6-10 | 4 | 3-5 | 3 | 2-5 | 3 | 2-5 |
| 55-64 | 11 | 9-13 | 5 | 4-7 | 6 | 4-8 | 4 | 3-6 |
| 65+ | 24 | 21-27 | 12 | 10-15 | 11 | 10-14 | 9 | 7-12 |
| Education | ||||||||
| < High school | 21 | 16-29 | 12 | 8-18 | 9 | 6-14 | 11 | 7-18 |
| High school | 15 | 13-18 | 8 | 7-10 | 7 | 5-9 | 6 | 5-8 |
| Some college | 13 | 11-16 | 7 | 5-9 | 6 | 5-8 | 5 | 4-7 |
| College degree | 8 | 7-9 | 3 | 2-4 | 5 | 4-6 | 2 | 2-3 |
| Household income | ||||||||
| < $15,000 | 24 | 17-32 | 11 | 7-19 | 12 | 7-19 | 10 | 6-17 |
| $15,000 to $24,999 | 29 | 23-37 | 16 | 11-23 | 13 | 9-19 | 13 | 8-20 |
| $25,000 to $49,999 | 17 | 14-20 | 8 | 6-11 | 7 | 5-9 | 7 | 5-10 |
| $50,000 to $74,999 | 13 | 10-16 | 7 | 5-10 | 6 | 4-9 | 4 | 3-6 |
| $75,000+ | 6 | 5-8 | 3 | 2-4 | 4 | 3-5 | 2 | 1-3 |
| Race | ||||||||
| White, non-Hispanic | 14 | 12-15 | 7 | 6-8 | 7 | 6-8 | 5 | 4-6 |
| Black, non-Hispanic | 12 | 9-16 | 5 | 3-8 | 4 | 3-7 | 6 | 4-9 |
| Hispanic | 11 | 6-19 | 4 | 2-9 | 2 | 1-5 | 7 | 3-16 |
| Sexual orientation | ||||||||
| Lesbian, gay or bisexual | 6 | 3-11 | 3 | 1-8 | 2 | 1-7 | 4 | 1-9 |
| Straight | 13 | 12-15 | 6 | 5-7 | 6 | 5-7 | 5 | 4-6 |
*Excludes missing, don't know and refused
Cardiovascular Disease Prevalence per 1,000 Pennsylvania Population,
Pennsylvania Adults, Age 35+, 2011-2021
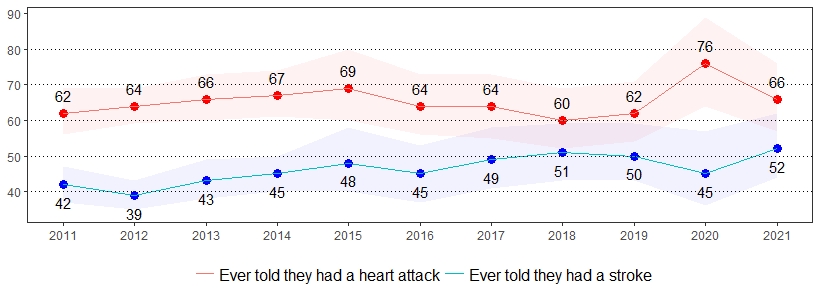
Color bands around estimates show 95% confidence intervals
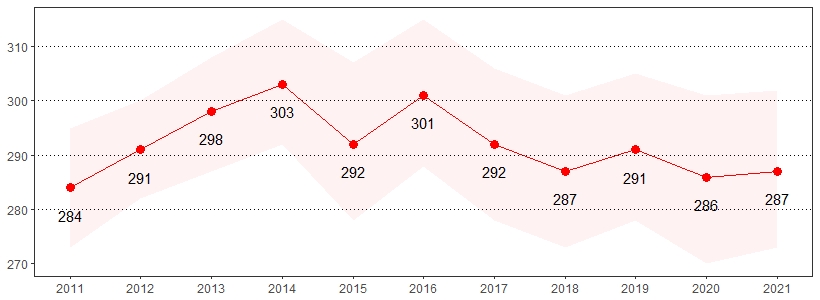
Cholesterol Awareness, Pennsylvania Adults, 2021
| Blood Cholesterol Checked in the Past 5 Years* |
Ever Told Have High Blood Cholesterol* | Currently Taking Medicine for High Blood Cholesterol* | ||||
|---|---|---|---|---|---|---|
| Demographics | % | CI | % | CI | % | CI |
| All adults | 87 | 86-88 | 35 | 33-37 | 27 | 26-29 |
| Gender | ||||||
| Male | 85 | 83-86 | 36 | 33-38 | 30 | 27-32 |
| Female | 90 | 88-91 | 34 | 32-36 | 25 | 23-27 |
| Age | ||||||
| 18-29 | 66 | 61-70 | 8 | 6-11 | 1 | 1-3 |
| 30-44 | 81 | 78-84 | 19 | 16-22 | 5 | 4-7 |
| 45-64 | 93 | 92-95 | 41 | 38-44 | 28 | 26-31 |
| 65+ | 97 | 96-98 | 51 | 47-54 | 55 | 51-58 |
| Education | ||||||
| < High school | 78 | 70-84 | 42 | 33-51 | 40 | 32-50 |
| High school | 87 | 85-89 | 36 | 33-39 | 31 | 28-34 |
| Some college | 86 | 84-88 | 35 | 32-38 | 26 | 23-39 |
| College degree | 91 | 90-92 | 32 | 30-34 | 21 | 20-23 |
| Household income | ||||||
| < $15,000 | 84 | 77-90 | 45 | 35-54 | 40 | 32-49 |
| $15,000 to $24,999 | 90 | 86-93 | 45 | 38-53 | 42 | 35-49 |
| $25,000 to $49,999 | 85 | 82-88 | 33 | 29-37 | 30 | 26-34 |
| $50,000 to $74,999 | 88 | 84-90 | 40 | 36-45 | 31 | 27-36 |
| $75,000+ | 88 | 86-90 | 32 | 30-35 | 21 | 18-23 |
| Race | ||||||
| White, non-Hispanic | 88 | 86-89 | 36 | 34-38 | 29 | 27-31 |
| Black, non-Hispanic | 88 | 85-91 | 33 | 28-38 | 30 | 25-35 |
| Hispanic | 86 | 79-90 | 29 | 22-36 | 15 | 10-21 |
| Sexual orientation | ||||||
| Lesbian, gay or bisexual | 74 | 66-82 | 24 | 18-32 | 12 | 8-18 |
| Straight | 89 | 87-90 | 35 | 34-37 | 28 | 27-30 |
*Excludes missing, don't know and refused
Cholesterol Awareness Prevalence per 1,000 Pennsylvania Population,
Pennsylvania Adults, 2011-2021
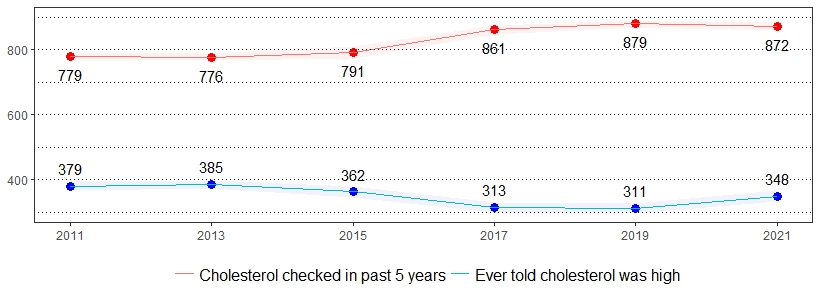
Color shading around estimates show 95% confidence intervals
Chronic Obstructive Pulmonary Disease (COPD), Pennsylvania Adults, 2021
| Ever Told They Have COPD, Emphysema or Chronic Bronchitis* | ||
|---|---|---|
| Demographics | % | CI |
| All adults | 7 | 6-8 |
| Gender | ||
| Male | 7 | 6-8 |
| Female | 7 | 6-8 |
| Age | ||
| 18-29 | 2 | 1-4 |
| 30-44 | 3 | 2-4 |
| 45-64 | 8 | 7-10 |
| 65+ | 12 | 10-14 |
| Education | ||
| < High school | 10 | 6-15 |
| High school | 9 | 8-11 |
| Some college | 7 | 6-9 |
| College degree | 2 | 2-3 |
| Household income | ||
| < $15,000 | 16 | 11-22 |
| $15,000 to $24,999 | 18 | 13-25 |
| $25,000 to $49,999 | 9 | 8-12 |
| $50,000 to $74,999 | 8 | 6-10 |
| $75,000+ | 2 | 2-4 |
| Race | ||
| White, non-Hispanic | 7 | 6-8 |
| Black, non-Hispanic | 5 | 3-8 |
| Hispanic | 5 | 3-9 |
| Sexual orientation | ||
| Lesbian, gay or bisexual | 8 | 4-13 |
| Straight | 7 | 6-8 |
*Excludes missing, don't know and refused
Chronic Obstructive Pulmonary Disease (COPD) Prevalence per 1,000 Pennsylvania Population, Pennsylvania Adults, 2011-2021
Color bands around estimates show 95% confidence intervals
Cognitive Decline, Pennsylvania Adults, Age 45+, 2021
| Experienced More Frequent or Worsening Confusion or Memory Loss in the Past Year* | Usually or Always Gives Up Household Activities or Chores Because of Confusion or Memory Loss* | Usually or Always Need Assistance With Day to Day Activities as a Result of Confusion or Memory Loss* | ||||
|---|---|---|---|---|---|---|
| Demographics | % | CI | % | CI | % | CI |
| All adults | 11 | 10-13 | 15 | 11-20 | 9 | 6-14 |
| Gender | ||||||
| Male | 12 | 10-15 | 15 | 9-23 | 9 | 4-18 |
| Female | 10 | 9-13 | 15 | 10-23 | 9 | 5-15 |
| Age | ||||||
| 45-64 | 10 | 8-12 | 18 | 12-26 | 9 | 5-15 |
| 65+ | 13 | 11-16 | 12 | 7-20 | 9 | 4-17 |
| Education | ||||||
| < High school | 14 | 8-23 | NSR | NSR | NSR | NSR |
| High school | 13 | 11-17 | 15 | 9-24 | 8 | 4-17 |
| Some college | 12 | 9-15 | 14 | 8-23 | 8 | 4-17 |
| College degree | 7 | 5-9 | 7 | 3-16 | 6 | 2-13 |
| Household income | ||||||
| < $15,000 | 19 | 12-28 | NSR | NSR | NSR | NSR |
| $15,000 to $24,999 | 18 | 12-27 | NSR | NSR | NSR | NSR |
| $25,000 to $49,999 | 14 | 11-18 | 23 | 13-37 | NSR | NSR |
| $50,000 to $74,999 | 12 | 9-16 | NSR | NSR | NSR | NSR |
| $75,000+ | 7 | 5-9 | 0 | 0-2 | NSR | NSR |
| Race | ||||||
| White, non-Hispanic | 10 | 9-12 | 12 | 8-17 | 7 | 4-12 |
| Black, non-Hispanic | 16 | 11-22 | NSR | NSR | NSR | NSR |
| Hispanic | 15 | 8-27 | NSR | NSR | NSR | NSR |
| Sexual orientation | ||||||
| Lesbian, gay or bisexual | 12 | 6-23 | NSR | NSR | NSR | NSR |
| Straight | 11 | 10-12 | 15 | 11-21 | 9 | 6-15 |
*Excludes missing, don't know and refused
Note: If "NSR" is displayed, then the total response is less than 50 and/or the percentage prevalence is considered "not statistically reliable."
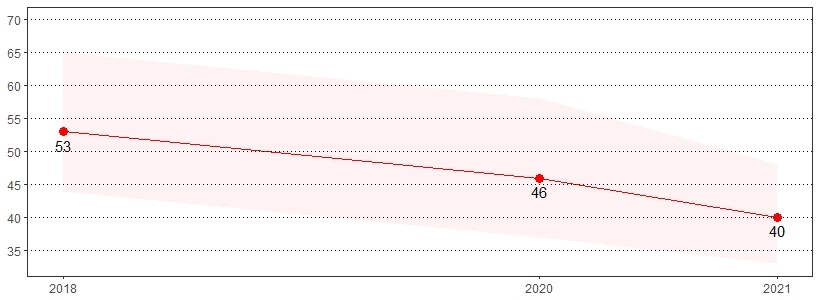
Experienced More Frequent or Worsening Confusion or Memory Loss in the Past Year Prevalence per 1,000 Pennsylvania Population, Pennsylvania Adults, Age 45+, 2018-2021
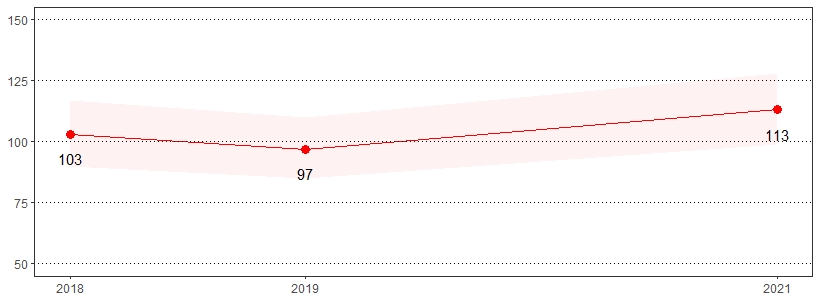
Color shading around estimates show 95% confidence intervals
Coronavirus (COVID-19) Pandemic, Pennsylvania Adults, 2021
| Lost Insurance Due to COVID-19 Pandemic Since March 1st, 2021* | Someone in Household Was Told By a Doctor, Nurse, or Other Health Professional They Had COVID-19* | |||
|---|---|---|---|---|
| Demographics | % | CI | % | CI |
| All adults | 3 | 2-4 | 22 | 20-23 |
| Gender | ||||
| Male | 4 | 3-5 | 22 | 20-25 |
| Female | 2 | 2-3 | 22 | 19-24 |
| Age | ||||
| 18-29 | 4 | 2-6 | 30 | 25-34 |
| 30-44 | 5 | 3-6 | 27 | 24-31 |
| 45-64 | 3 | 2-5 | 22 | 20-25 |
| 65+ | 0 | 0-1 | 12 | 10-15 |
| Education | ||||
| < High school | 2 | 1-5 | 20 | 14-29 |
| High school | 3 | 2-5 | 21 | 18-24 |
| Some college | 4 | 3-5 | 25 | 22-28 |
| College degree | 2 | 2-3 | 21 | 19-23 |
| Household income | ||||
| < $15,000 | 5 | 3-9 | 12 | 8-18 |
| $15,000 to $24,999 | 4 | 2-8 | 21 | 18-24 |
| $25,000 to $49,999 | 3 | 2-4 | 18 | 15-22 |
| $50,000 to $74,999 | 3 | 2-5 | 20 | 17-24 |
| $75,000+ | 2 | 1-3 | 27 | 25-30 |
| Race | ||||
| White, non-Hispanic | 2 | 1-2 | 22 | 20-24 |
| Black, non-Hispanic | 7 | 5-11 | 18 | 15-23 |
| Hispanic | 7 | 4-12 | 31 | 24-39 |
| Sexual orientation | ||||
| Lesbian, gay or bisexual | 6 | 3-11 | 17 | 12-24 |
| Straight | 3 | 2-3 | 22 | 21-24 |
*Excludes missing, don't know and refused
Note: No trend available. These questions were first asked in 2021.
Depression, Pennsylvania Adults, 2021
| Ever Told They Have Some Form of Depressive Disorder* | ||
|---|---|---|
| Demographics | % | CI |
| All adults | 19 | 18-20 |
| Gender | ||
| Male | 14 | 13-16 |
| Female | 24 | 22-25 |
| Age | ||
| 18-29 | 26 | 22-30 |
| 30-44 | 20 | 17-22 |
| 45-64 | 19 | 17-21 |
| 65+ | 14 | 12-17 |
| Education | ||
| < High school | 20 | 15-27 |
| High school | 20 | 18-22 |
| Some college | 21 | 18-23 |
| College degree | 17 | 15-18 |
| Household income | ||
| < $15,000 | 34 | 27-41 |
| $15,000 to $24,999 | 29 | 24-35 |
| $25,000 to $49,999 | 21 | 18-24 |
| $50,000 to $74,999 | 19 | 16-23 |
| $75,000+ | 14 | 13-16 |
| Race | ||
| White, non-Hispanic | 20 | 18-21 |
| Black, non-Hispanic | 17 | 14-20 |
| Hispanic | 16 | 12-21 |
| Sexual orientation | ||
| Lesbian, gay or bisexual | 45 | 38-53 |
| Straight | 17 | 16-19 |
*Excludes missing, don't know and refused
Depression Prevalence per 1,000 Pennsylvania Population,
Pennsylvania Adults, 2011-2021
Color bands around estimates show 95% confidence intervals
Diabetes, Pennsylvania Adults, 2021
| Ever Told Have Diabetes* | Now Taking Insulin* ** | Check Their Blood Sugar Daily* ** |
Saw Doctor 4+ Times in Past Year for Diabetes* ** |
|||||
|---|---|---|---|---|---|---|---|---|
| Demographics | % | CI | % | CI | % | CI | % | CI |
| All adults | 11 | 10-12 | 39 | 35-44 | 62 | 57-67 | 36 | 31-41 |
| Gender | ||||||||
| Male | 12 | 11-14 | 41 | 34-48 | 60 | 53-66 | 32 | 26-39 |
| Female | 10 | 9-11 | 38 | 31-45 | 64 | 56-71 | 39 | 32-47 |
| Age | ||||||||
| 18-29 | 2 | 1-4 | NSR | NSR | NSR | NSR | NSR | NSR |
| 30-44 | 4 | 3-6 | NSR | NSR | NSR | NSR | NSR | NSR |
| 45-64 | 13 | 12-16 | 40 | 32-48 | 60 | 52-67 | 31 | 25-39 |
| 65+ | 22 | 19-24 | 37 | 30-44 | 63 | 56-70 | 39 | 32-47 |
| Education | ||||||||
| < High school | 15 | 11-20 | NSR | NSR | NSR | NSR | NSR | NSR |
| High School | 14 | 12-16 | 33 | 27-41 | 59 | 50-66 | 36 | 28-44 |
| Some college | 11 | 9-13 | 55 | 46-64 | 66 | 58-74 | 40 | 31-50 |
| College degree | 7 | 6-8 | 33 | 25-41 | 61 | 52-69 | 27 | 20-35 |
| Household income | ||||||||
| < $15,000 | 18 | 13-25 | NSR | NSR | NSR | NSR | NSR | NSR |
| $15,000 to $24,999 | 23 | 18-30 | 31 | 20-45 | NSR | NSR | NSR | NSR |
| $25,000 to $49,999 | 13 | 11-16 | 38 | 29-48 | 57 | 46-67 | 34 | 25-45 |
| $50,000 to $74,999 | 9 | 7-12 | NSR | NSR | NSR | NSR | NSR | NSR |
| $75,000+ | 8 | 6-9 | 47 | 37-58 | 63 | 53-72 | 34 | 25-45 |
| Race | ||||||||
| White, non-Hispanic | 10 | 9-12 | 36 | 31-42 | 58 | 52-64 | 35 | 30-42 |
| Black, non-Hispanic | 17 | 14-21 | 53 | 41-64 | 65 | 53-76 | 37 | 26-49 |
| Hispanic | 14 | 10-19 | NSR | NSR | NSR | NSR | NSR | NSR |
| Sexual orientation | ||||||||
| Lesbian, gay or bisexual | 8 | 4-13 | NSR | NSR | NSR | NSR | NSR | NSR |
| Straight | 11 | 10-13 | 39 | 34-44 | 62 | 57-67 | 34 | 29-39 |
*Excludes missing, don't know and refused
**Denominator is persons who have diabetes
Note: If "NSR" is displayed, then the total response is less than 50 and/or the percentage prevalence is considered "not statistically reliable."
Diabetes Prevalence per 1,000 Pennsylvania Population,
Pennsylvania Adults, 2011-2021
Color shading around estimates show 95% confidence intervals
E-Cigarettes, Pennsylvania Adults, 2021
| Currently Use E-Cigarette or Other Electronic Vaping Product Every Day* | Currently Use E-Cigarette or Other Electronic Vaping Product Some Days* | Currently Use E-Cigarette or Other Electronic Vaping Product Every Day or Some Days* | ||||
|---|---|---|---|---|---|---|
| Demographics | % | CI | % | CI | % | CI |
| All adults | 3 | 2-3 | 3 | 3-4 | 6 | 5-7 |
| Gender | ||||||
| Male | 3 | 2-4 | 4 | 3-5 | 7 | 6-8 |
| Female | 3 | 2-4 | 3 | 2-4 | 5 | 4-7 |
| Age | ||||||
| 18-29 | 7 | 6-10 | 9 | 7-12 | 17 | 14-20 |
| 30-44 | 3 | 2-5 | 3 | 2-4 | 6 | 5-8 |
| 45-64 | 2 | 1-3 | 2 | 1-3 | 4 | 3-5 |
| 65+ | 0 | 0-1 | 1 | 0-1 | 1 | 1-2 |
| Education | ||||||
| < High school | 3 | 1-10 | 3 | 1-9 | 7 | 3-14 |
| High school | 4 | 3-5 | 4 | 3-6 | 8 | 7-10 |
| Some college | 3 | 2-4 | 3 | 2-4 | 6 | 5-7 |
| College degree | 2 | 1-2 | 2 | 2-3 | 4 | 3-5 |
| Household income | ||||||
| < $15,000 | 1 | 0-3 | 4 | 3-8 | 5 | 3-8 |
| $15,000 to $24,999 | 4 | 3-5 | 3 | 1-6 | 5 | 3-7 |
| $25,000 to $49,999 | 4 | 3-5 | 3 | 2-4 | 7 | 5-9 |
| $50,000 to $74,999 | 3 | 2-4 | 3 | 2-5 | 6 | 4-8 |
| $75,000+ | 3 | 2-4 | 2 | 2-3 | 5 | 4-7 |
| Race | ||||||
| White, non-Hispanic | 3 | 2-3 | 3 | 2-4 | 6 | 5-7 |
| Black, non-Hispanic | 1 | 1-3 | 5 | 3-7 | 6 | 4-9 |
| Hispanic | 7 | 3-15 | 2 | 1-5 | 10 | 5-17 |
| Sexual orientation | ||||||
| Lesbian, gay or bisexual | 8 | 4-14 | 8 | 5-14 | 16 | 11-23 |
| Straight | 2 | 2-3 | 3 | 2-4 | 5 | 5-6 |
*Excludes missing, don't know and refused
Note: No trend available. These questions were first asked in 2021.
Exercise, Pennsylvania Adults, 2021
| Participated in No Physical Activity in the Past Month* ** | ||
|---|---|---|
| Demographics | % | CI |
| All adults | 24 | 23-26 |
| Gender | ||
| Male | 22 | 20-24 |
| Female | 27 | 25-29 |
| Age | ||
| 18-29 | 16 | 13-19 |
| 30-44 | 20 | 17-23 |
| 45-64 | 26 | 24-28 |
| 65+ | 32 | 29-35 |
| Education | ||
| < High school | 36 | 29-43 |
| High School | 31 | 28-34 |
| Some college | 24 | 21-26 |
| College degree | 13 | 12-15 |
| Household income | ||
| < $15,000 | 44 | 36-52 |
| $15,000 to $24,999 | 35 | 30-41 |
| $25,000 to $49,999 | 32 | 28-35 |
| $50,000 to $74,999 | 21 | 18-25 |
| $75,000+ | 16 | 14-18 |
| Race | ||
| White, non-Hispanic | 23 | 22-25 |
| Black, non-Hispanic | 33 | 28-37 |
| Hispanic | 25 | 20-31 |
| Sexual orientation | ||
| Lesbian, gay or bisexual | 23 | 17-29 |
| Straight | 25 | 23-26 |
*Excludes missing, don't know and refused
**Odd years of survey include the following interviewer instruction: If respondent does not have a "regular job duty" or is retired, they may count the physical activity or exercise they spend the most time doing in a regular month.
Exercise Prevalence per 1,000 Pennsylvania Population,
Pennsylvania Adults, 2011-2021
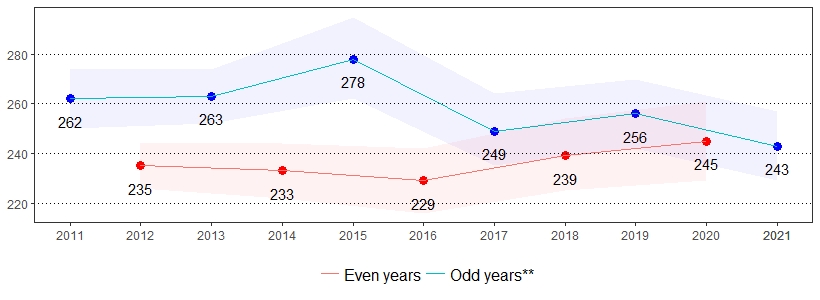
Color bands around estimates show 95% confidence intervals
Fruits and Vegetables, Pennsylvania Adults, 2021
| Eat Five or More Fruits or Vegetables Daily* | Consume Two or More Fruits or 100% Fruit Juice Daily* | Consume Three or More Vegetables or Salads Daily* | ||||
|---|---|---|---|---|---|---|
| Demographics | % | CI | % | CI | % | CI |
| All adults | 14 | 12-16 | 34 | 32-36 | 10 | 9-11 |
| Gender | ||||||
| Male | 12 | 10-14 | 33 | 30-36 | 8 | 7-10 |
| Female | 16 | 13-19 | 35 | 32-39 | 11 | 10-13 |
| Age | ||||||
| 18-29 | 14 | 10-19 | 31 | 26-37 | 10 | 7-14 |
| 30-44 | 16 | 12-20 | 33 | 29-38 | 12 | 10-15 |
| 45-64 | 13 | 10-16 | 32 | 28-35 | 10 | 8-12 |
| 65+ | 13 | 10-17 | 41 | 37-46 | 8 | 6-10 |
| Education | ||||||
| < High school | 20 | 11-32 | 37 | 27-48 | 9 | 4-17 |
| High school | 15 | 12-18 | 33 | 30-37 | 9 | 7-11 |
| Some college | 11 | 9-14 | 33 | 29-37 | 9 | 7-11 |
| College degree | 13 | 11-15 | 35 | 32-38 | 12 | 11-14 |
| Household income | ||||||
| < $15,000 | NSR | NSR | 46 | 35-58 | 4 | 2-8 |
| $15,000 to $24,999 | 15 | 10-21 | 37 | 30-46 | 9 | 6-13 |
| $25,000 to $49,999 | 12 | 9-16 | 33 | 29-38 | 9 | 6-11 |
| $50,000 to $74,999 | 10 | 7-14 | 32 | 27-37 | 10 | 7-12 |
| $75,000+ | 14 | 11-18 | 32 | 28-36 | 11 | 10-14 |
| Race | ||||||
| White, non-Hispanic | 13 | 11-15 | 34 | 31-36 | 9 | 8-11 |
| Black, non-Hispanic | 14 | 10-20 | 36 | 30-42 | 11 | 8-15 |
| Hispanic | 21 | 14-30 | 35 | 28-44 | 12 | 7-18 |
| Sexual orientation | ||||||
| Lesbian, gay or bisexual | 13 | 8-21 | 37 | 27-47 | 10 | 7-16 |
| Straight | 14 | 12-16 | 34 | 31-36 | 10 | 9-12 |
*Excludes missing, don't know and refused
Note: If "NSR" is displayed, then the total response is less than 50 and/or the percentage prevalence is considered "not statistically reliable."
Consume Two or More Fruits or 100% Fruit Juice Daily
Prevalence per 1,000 Pennsylvania Population, Pennsylvania Adults, 2011-2021
Color shading around estimates show 95% confidence intervals
General Health, Pennsylvania Adults, 2021
| Fair or Poor General Health* | ||
|---|---|---|
| Demographics | % | CI |
| All Adults | 16 | 15-17 |
| Gender | ||
| Male | 16 | 14-18 |
| Female | 16 | 15-18 |
| Age | ||
| 18-29 | 10 | 8-13 |
| 30-44 | 8 | 7-10 |
| 45-64 | 19 | 17-21 |
| 65+ | 26 | 23-29 |
| Education | ||
| < High school | 31 | 25-38 |
| High school | 20 | 18-23 |
| Some college | 15 | 13-18 |
| College degree | 8 | 6-9 |
| Household income | ||
| < $15,000 | 44 | 36-52 |
| $15,000 to $24,999 | 36 | 30-42 |
| $25,000 to $49,999 | 19 | 16-22 |
| $50,000 to $74,999 | 12 | 10-16 |
| $75,000+ | 8 | 6-9 |
| Race | ||
| White, non-Hispanic | 15 | 14-17 |
| Black, non-Hispanic | 22 | 19-26 |
| Hispanic | 19 | 14-25 |
| Sexual orientation | ||
| Lesbian, gay or bisexual | 20 | 14-27 |
| Straight | 16 | 15-17 |
*Excludes missing, don't know and refused
General Health Prevalence per 1,000 Pennsylvania Population,
Pennsylvania Adults, 2011-2021
Color bands around estimates show 95% confidence intervals
Health Care Access, Pennsylvania Adults, 2021
| Does Not Have a Personal Health Care Provider* | Couldn't Afford to Receive Care in the Past Year* |
Visited a Doctor for a Routine Checkup in the Past 2 Years* | ||||
|---|---|---|---|---|---|---|
| Demographics | % | CI | % | CI | % | CI |
| All adults | 11 | 10-12 | 7 | 6-8 | 90 | 89-91 |
| Gender | ||||||
| Male | 15 | 13-16 | 6 | 5-8 | 86 | 85-88 |
| Female | 7 | 6-8 | 7 | 6-8 | 93 | 92-95 |
| Age | ||||||
| 18-29 | 21 | 17-24 | 11 | 9-14 | 84 | 81-87 |
| 30-44 | 17 | 15-20 | 8 | 7-10 | 83 | 81-86 |
| 45-64 | 6 | 5-8 | 6 | 5-8 | 92 | 90-93 |
| 65+ | 3 | 2-4 | 3 | 2-4 | 98 | 97-98 |
| Education | ||||||
| < High school | 17 | 12-24 | 8 | 5-13 | 85 | 79-90 |
| High school | 11 | 9-12 | 7 | 6-9 | 90 | 88-92 |
| Some college | 10 | 9-12 | 8 | 7-10 | 90 | 88-92 |
| College degree | 9 | 8-10 | 4 | 4-5 | 90 | 89-92 |
| Household income | ||||||
| < $15,000 | 10 | 6-16 | 14 | 10-20 | 87 | 79-92 |
| $15,000 to $24,999 | 9 | 6-12 | 10 | 7-14 | 92 | 88-94 |
| $25,000 to $49,999 | 13 | 11-16 | 10 | 8-13 | 88 | 85-91 |
| $50,000 to $74,999 | 9 | 7-12 | 6 | 4-8 | 90 | 88-93 |
| $75,000+ | 8 | 7-10 | 4 | 3-6 | 89 | 87-91 |
| Race | ||||||
| White, non-Hispanic | 9 | 8-10 | 5 | 5-6 | 90 | 88-91 |
| Black, non-Hispanic | 9 | 7-12 | 12 | 9-15 | 93 | 91-95 |
| Hispanic | 21 | 16-27 | 13 | 9-18 | 89 | 83-93 |
| Sexual orientation | ||||||
| Lesbian, gay or bisexual | 13 | 9-19 | 14 | 10-20 | 84 | 77-89 |
| Straight | 9 | 8-10 | 6 | 5-7 | 90 | 89-91 |
*Excludes missing, don't know and refused
Health Care Access Prevalence per 1,000 Pennsylvania Population,
Pennsylvania Adults, 2011-2021
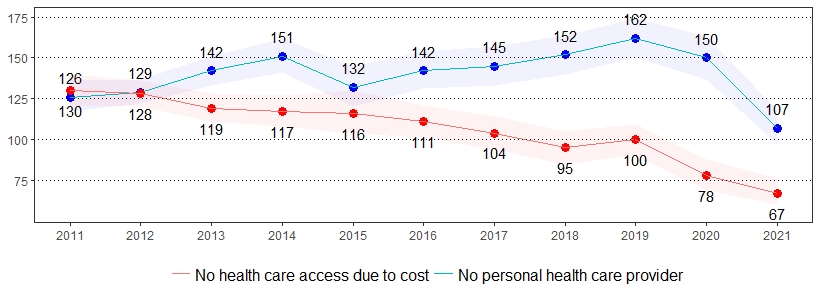
Color bands around estimates show 95% confidence intervals
Hearing and Vision Problem, Pennsylvania Adults, 2021
| Deaf or Serious Difficulty Hearing* | Blind or Serious Difficulty Seeing, Even With Glasses* |
|||
|---|---|---|---|---|
| Demographics | % | CI | % | CI |
| All adults | 8 | 7-9 | 5 | 4-5 |
| Gender | ||||
| Male | 11 | 9-12 | 4 | 4-5 |
| Female | 5 | 4-7 | 5 | 4-6 |
| Age | ||||
| 18-29 | 3 | 2-5 | 3 | 2-5 |
| 30-44 | 2 | 2-4 | 3 | 2-4 |
| 45-64 | 7 | 6-9 | 4 | 3-5 |
| 65+ | 18 | 15-21 | 8 | 6-10 |
| Education | ||||
| < High school | 12 | 8-17 | 11 | 8-16 |
| High school | 11 | 9-13 | 5 | 4-7 |
| Some college | 7 | 6-9 | 5 | 4-6 |
| College degree | 4 | 3-5 | 2 | 2-3 |
| Household income | ||||
| < $15,000 | 6 | 4-11 | 16 | 11-23 |
| $15,000 to $24,999 | 13 | 9-19 | 12 | 8-17 |
| $25,000 to $49,999 | 9 | 7-12 | 6 | 4-8 |
| $50,000 to $74,999 | 8 | 6-11 | 2 | 1-3 |
| $75,000+ | 5 | 4-7 | 1 | 1-2 |
| Race | ||||
| White, non-Hispanic | 9 | 8-10 | 4 | 3-4 |
| Black, non-Hispanic | 4 | 3-7 | 7 | 5-10 |
| Hispanic | 5 | 3-10 | 10 | 7-15 |
| Sexual orientation | ||||
| Lesbian, gay or bisexual | 7 | 3-14 | 5 | 3-9 |
| Straight | 7 | 7-8 | 4 | 4-5 |
*Excludes missing, don't know and refused
Vision Problem Prevalence per 1,000 Pennsylvania Population,
Pennsylvania Adults, 2013-2021
Color bands around estimates show 95% confidence intervals
HIV/AIDS, Pennsylvania Adults, Age 18-64, 2021
| Ever Tested for HIV, Except Blood Donation* |
Tested for HIV in the Past Year, Except Blood Donation* |
|||
|---|---|---|---|---|
| Demographics | % | CI | % | CI |
| All adults | 39 | 37-41 | 10 | 9-11 |
| Gender | ||||
| Male | 37 | 35-40 | 9 | 7-11 |
| Female | 41 | 38-44 | 11 | 9-13 |
| Age | ||||
| 18-29 | 34 | 29-38 | 12 | 9-15 |
| 30-44 | 47 | 43-51 | 12 | 10-15 |
| 45-64 | 36 | 33-39 | 7 | 5-8 |
| Education | ||||
| < High school | 44 | 34-54 | 10 | 6-18 |
| High school | 38 | 34-41 | 10 | 7-12 |
| Some college | 39 | 36-43 | 10 | 8-13 |
| College degree | 39 | 36-42 | 9 | 7-12 |
| Household income | ||||
| < $15,000 | 55 | 46-64 | 19 | 13-28 |
| $15,000 to $24,999 | 50 | 42-57 | 18 | 11-26 |
| $25,000 to $49,999 | 44 | 39-48 | 12 | 9-16 |
| $50,000 to $74,999 | 40 | 35-45 | 8 | 6-12 |
| $75,000+ | 36 | 33-39 | 8 | 6-10 |
| Race | ||||
| White, non-Hispanic | 33 | 31-35 | 6 | 5-8 |
| Black, non-Hispanic | 63 | 58-68 | 24 | 19-30 |
| Hispanic | 58 | 50-66 | 21 | 14-30 |
| Sexual orientation | ||||
| Lesbian, gay or bisexual | 52 | 44-60 | 22 | 15-31 |
| Straight | 37 | 35-39 | 8 | 7-10 |
*Excludes missing, don't know and refused
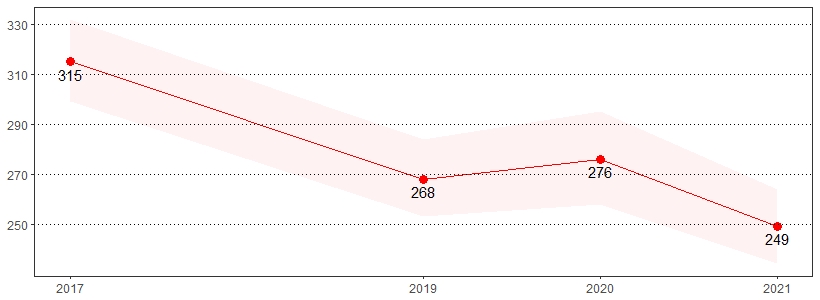
Ever Tested for HIV, Except Blood Donation Prevalence per 1,000 Pennsylvania Population,
Pennsylvania Adults, Age 18-64, 2011-2021
Color bands around estimates show 95% confidence intervals
Hypertension Awareness, Pennsylvania Adults, 2021
| Ever Told Have High Blood Pressure* | Currently Taking Medicine for High Blood Pressure* |
|||
|---|---|---|---|---|
| Demographics | % | CI | % | CI |
| All adults | 34 | 32-35 | 80 | 77-82 |
| Gender | ||||
| Male | 37 | 35-39 | 77 | 74-80 |
| Female | 31 | 29-33 | 83 | 80-86 |
| Age | ||||
| 18-29 | 9 | 7-11 | 16 | 9-26 |
| 30-44 | 17 | 15-20 | 48 | 40-55 |
| 45-64 | 40 | 37-43 | 83 | 79-86 |
| 65+ | 61 | 58-64 | 94 | 91-96 |
| Education | ||||
| < High school | 44 | 36-51 | 79 | 68-86 |
| High school | 38 | 35-41 | 83 | 80-87 |
| Some college | 33 | 30-36 | 78 | 73-82 |
| College degree | 26 | 24-28 | 77 | 74-81 |
| Household income | ||||
| < $15,000 | 46 | 38-54 | NSR | NSR |
| $15,000 to $24,999 | 51 | 45-57 | 90 | 84-93 |
| $25,000 to $49,999 | 39 | 36-43 | 81 | 76-85 |
| $50,000 to $74,999 | 37 | 33-41 | 80 | 74-85 |
| $75,000+ | 27 | 25-30 | 74 | 69-79 |
| Race | ||||
| White, non-Hispanic | 34 | 33-36 | 82 | 79-84 |
| Black, non-Hispanic | 43 | 38-47 | 85 | 80-89 |
| Hispanic | 25 | 19-32 | NSR | NSR |
| Sexual orientation | ||||
| Lesbian, gay or bisexual | 15 | 11-20 | NSR | NSR |
| Straight | 36 | 34-37 | 81 | 79-84 |
*Excludes missing, don't know and refused
Note: If "NSR" is displayed, then the total response is less than 50 and/or the percentage prevalence is considered "not statistically reliable."
Ever Told High Blood Pressure Prevalence per 1,000 Pennsylvania Population,
Pennsylvania Adults, 2011-2021
Color shading around estimates show 95% confidence intervals
Immunization, Pennsylvania Adults, 2021
| Had Flu Shot or Flu Vaccine Sprayed in Nose in the Past Year* | Ever Had Pneumonia Vaccination, Age 65+* | |||
|---|---|---|---|---|
| Demographics | % | CI | % | CI |
| All adults | 50 | 48-52 | 70 | 67-73 |
| Gender | ||||
| Male | 45 | 43-47 | 65 | 61-70 |
| Female | 55 | 52-57 | 74 | 70-78 |
| Age | ||||
| 18-29 | 35 | 31-39 | NSR | NSR |
| 30-44 | 37 | 34-40 | NSR | NSR |
| 45-64 | 52 | 50-55 | NSR | NSR |
| 65+ | 71 | 68-74 | 70 | 67-73 |
| Education | ||||
| < High school | 40 | 33-49 | 76 | 64-84 |
| High school | 46 | 43-49 | 66 | 60-71 |
| Some college | 49 | 46-52 | 71 | 65-77 |
| College degree | 59 | 56-61 | 75 | 70-79 |
| Household income | ||||
| < $15,000 | 41 | 33-49 | NSR | NSR |
| $15,000 to $24,999 | 48 | 42-54 | 67 | 56-77 |
| $25,000 to $49,999 | 47 | 43-51 | 73 | 66-78 |
| $50,000 to $74,999 | 55 | 51-59 | 71 | 63-78 |
| $75,000+ | 51 | 48-54 | 73 | 66-78 |
| Race | ||||
| White, non-Hispanic | 53 | 51-55 | 72 | 68-75 |
| Black, non-Hispanic | 39 | 35-44 | 64 | 53-74 |
| Hispanic | 40 | 33-48 | NSR | NSR |
| Sexual orientation | ||||
| Lesbian, gay or bisexual | 42 | 35-49 | NSR | NSR |
| Straight | 51 | 49-53 | 70 | 67-73 |
*Excludes missing, don't know and refused
Note: If "NSR" is displayed, then the total response is less than 50 and/or the percentage prevalence is considered "not statistically reliable."
Immunization Prevalence per 1,000 Pennsylvania Population,
Pennsylvania Adults, 2011-2021
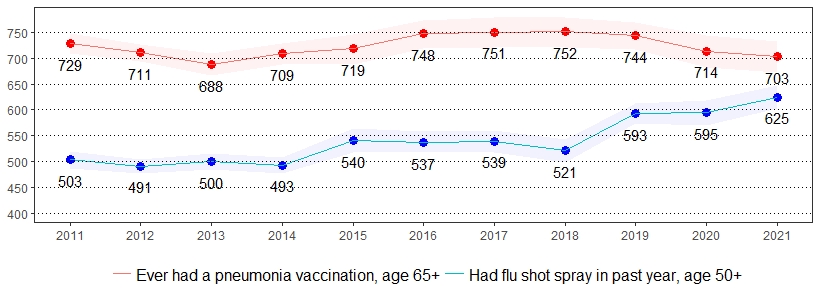
Color bands around estimates show 95% confidence intervals
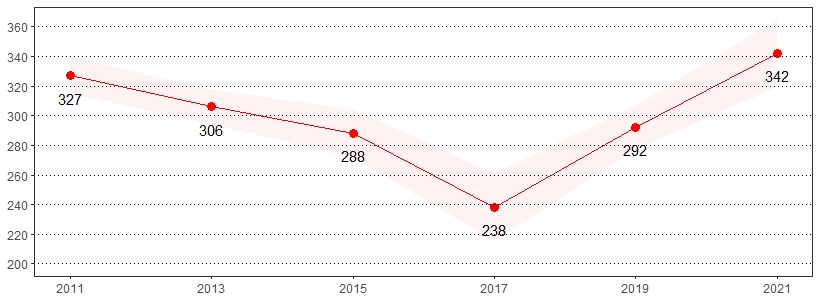
Intimate Partner Violence, Pennsylvania Adults, 2021
| Ever Had Sex Without Their Consent After Indicating They Didn't Want Them To* | Ever Hit, Slapped, Pushed, Kicked or Hurt in Any Way by an Intimate Partner* | Ever Threatened by an Intimate Partner With Physical Violence* | Someone Touched Sexual Parts of Their Body Without Consent in the Past Year After Indicating They Didn't Want Them To* | |||||
|---|---|---|---|---|---|---|---|---|
| Demographics | % | CI | % | CI | % | CI | % | CI |
| All adults | 7 | 6-8 | 13 | 12-14 | 10 | 9-11 | 2 | 1-2 |
| Gender | ||||||||
| Male | 4 | 3-5 | 11 | 9-12 | 7 | 6-9 | 2 | 1-3 |
| Female | 10 | 9-12 | 15 | 13-17 | 13 | 11-14 | 1 | 1-2 |
| Age | ||||||||
| 18-29 | 13 | 10-16 | 15 | 12-19 | 12 | 9-15 | 4 | 3-7 |
| 30-44 | 9 | 7-11 | 20 | 17-23 | 16 | 13-19 | 3 | 1-4 |
| 45-64 | 6 | 5-8 | 12 | 10-14 | 9 | 8-11 | 1 | 1-2 |
| 65+ | 4 | 2-6 | 6 | 5-8 | 5 | 4-6 | 0 | 0-0 |
| Education | ||||||||
| < High school | 7 | 4-14 | 15 | 10-23 | 13 | 8-21 | 1 | 0-4 |
| High school | 6 | 5-8 | 13 | 11-15 | 10 | 8-12 | 2 | 2-4 |
| Some college | 8 | 7-11 | 14 | 12-16 | 11 | 9-13 | 1 | 1-3 |
| College degree | 7 | 6-9 | 11 | 10-13 | 9 | 7-10 | 1 | 1-1 |
| Household income | ||||||||
| < $15,000 | 12 | 7-18 | 21 | 14-29 | 17 | 11-25 | 2 | 1-6 |
| $15,000 to $24,999 | 9 | 5-13 | 14 | 10-19 | 10 | 7-15 | 3 | 1-7 |
| $25,000 to $49,999 | 9 | 7-11 | 15 | 13-19 | 12 | 10-16 | 2 | 1-4 |
| $50,000 to $74,999 | 10 | 7-13 | 14 | 11-17 | 9 | 7-12 | 1 | 1-3 |
| $75,000+ | 6 | 5-8 | 11 | 9-13 | 9 | 7-12 | 1 | 1-3 |
| Race | ||||||||
| White, non-Hispanic | 7 | 6-8 | 12 | 11-13 | 9 | 8-11 | 1 | 1-2 |
| Black, non-Hispanic | 10 | 7-14 | 17 | 13-21 | 12 | 9-16 | 3 | 2-7 |
| Hispanic | 8 | 5-13 | 17 | 11-26 | 18 | 11-27 | 4 | 2-9 |
| Sexual orientation | ||||||||
| Lesbian, gay or bisexual | 28 | 21-36 | 25 | 19-32 | 20 | 15-27 | 6 | 3-11 |
| Straight | 6 | 5-7 | 12 | 11-13 | 9 | 8-10 | 1 | 1-2 |
*Excludes missing, don't know and refused
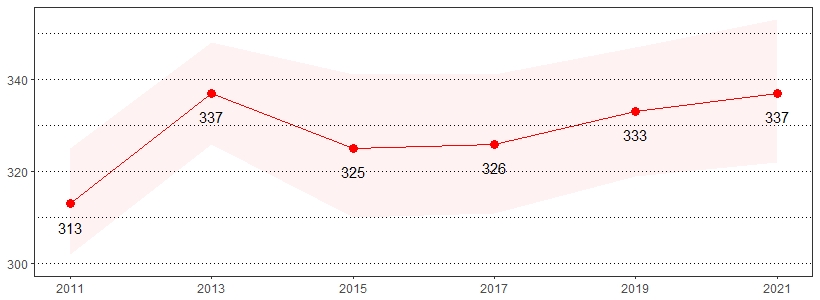
Ever Had Sex Without Their Consent After Indicating They Didn't Want Them To Prevalence per 1,000 Pennsylvania Population, Pennsylvania Adults, 2015-2021
Color bands around estimates show 95% confidence intervals
Kidney Disease, Pennsylvania Adults, 2021
| Ever Told Have Kidney Disease* | ||
|---|---|---|
| Demographics | % | CI |
| All adults | 3 | 3-4 |
| Gender | ||
| Male | 3 | 3-4 |
| Female | 3 | 2-4 |
| Age | ||
| 18-29 | 1 | 1-3 |
| 30-44 | 1 | 1-2 |
| 45-64 | 3 | 2-4 |
| 65+ | 7 | 6-9 |
| Education | ||
| < High school | 5 | 3-8 |
| High school | 3 | 2-4 |
| Some college | 4 | 3-5 |
| College degree | 2 | 2-3 |
| Household income | ||
| < $15,000 | 5 | 3-9 |
| $15,000 to $24,999 | 7 | 4-12 |
| $25,000 to $49,999 | 4 | 3-6 |
| $50,000 to $74,999 | 2 | 1-3 |
| $75,000+ | 2 | 2-3 |
| Race | ||
| White, non-Hispanic | 3 | 3-4 |
| Black, non-Hispanic | 5 | 3-8 |
| Hispanic | 2 | 1-4 |
| Sexual orientation | ||
| Lesbian, gay or bisexual | 2 | 1-5 |
| Straight | 3 | 3-4 |
*Excludes missing, don't know and refused
Kidney Disease Prevalence per 1,000 Pennsylvania Population,
Pennsylvania Adults, 2011-2021
Color bands around estimates show 95% confidence intervals
Occupational Health, Pennsylvania Adults, 2021
| Received Medical Advice After Being Injured Seriously Enough Performing Their Job in the Past Year* |
||
|---|---|---|
| Demographics | % | CI |
| All adults | 4 | 3-5 |
| Gender | ||
| Male | 5 | 4-6 |
| Female | 3 | 2-4 |
| Age | ||
| 18-29 | 2 | 1-4 |
| 30-44 | 5 | 4-7 |
| 45-64 | 4 | 3-5 |
| 65+ | 3 | 2-7 |
| Education | ||
| < High school | 4 | 1-12 |
| High school | 4 | 3-5 |
| Some college | 5 | 3-7 |
| College degree | 4 | 3-5 |
| Household income | ||
| < $15,000 | NSR | NSR |
| $15,000 to $24,999 | 7 | 4-15 |
| $25,000 to $49,999 | 5 | 3-7 |
| $50,000 to $74,999 | 5 | 3-7 |
| $75,000+ | 3 | 2-4 |
| Race | ||
| White, non-Hispanic | 4 | 3-5 |
| Black, non-Hispanic | 5 | 3-8 |
| Hispanic | 8 | 4-15 |
| Sexual orientation | ||
| Lesbian, gay or bisexual | 4 | 2-9 |
| Straight | 4 | 3-5 |
*Excludes missing, don't know and refused
Note: If "NSR" is displayed, then the total response is less than 50 and/or the percentage prevalence is considered "not statistically reliable."
Received Medical Advice After Being Injured Seriously Enough Performing Their Job in the Past Year
Prevalence per 1,000 Pennsylvania Population, Pennsylvania Adults, 2018-2021
Color bands around estimates show 95% confidence intervals
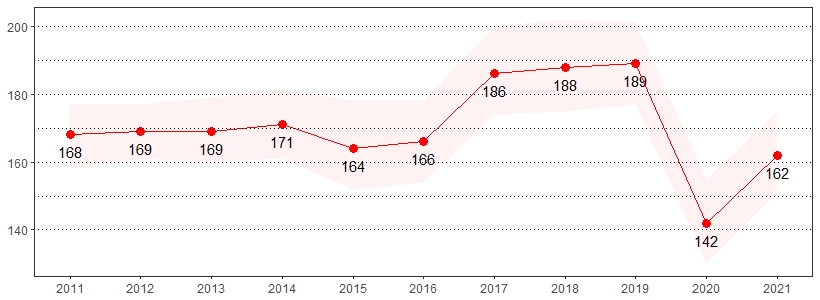
Opioid Use, Pennsylvania Adults, 2021
| Used Any Prescription Pain Medications in the Past Year* | Used Prescription Pain Medicines Not Prescribed to You in the Past Year* | Used Non-Prescription Street Drugs That Were Injected or Snorted in the Past Year* | Administered Naloxone or Narcan on Someone in the Past Year* | |||||
|---|---|---|---|---|---|---|---|---|
| Demographics | % | CI | % | CI | % | CI | % | CI |
| All adults | 25 | 23-26 | 11 | 9-14 | 1 | 1-2 | 2 | 1-2 |
| Gender | ||||||||
| Male | 22 | 20-24 | 14 | 10-18 | 2 | 1-3 | 2 | 2-3 |
| Female | 27 | 25-30 | 10 | 7-13 | 1 | 1-2 | 1 | 1-2 |
| Age | ||||||||
| 18-29 | 19 | 16-23 | 11 | 6-19 | 3 | 2-4 | 3 | 2-4 |
| 30-44 | 20 | 17-23 | 11 | 6-19 | 3 | 2-5 | 3 | 2-4 |
| 45-64 | 27 | 25-30 | 10 | 7-13 | 1 | 0-1 | 1 | 1-2 |
| 65+ | 31 | 28-34 | 14 | 10-19 | 1 | 0-1 | 0 | 0-1 |
| Education | ||||||||
| < High school | 27 | 21-36 | NSR | NSR | 2 | 1-5 | 2 | 1-5 |
| High school | 26 | 24-29 | 12 | 9-16 | 1 | 1-2 | 1 | 1-2 |
| Some college | 29 | 26-32 | 8 | 6-12 | 2 | 1-3 | 1 | 1-2 |
| College degree | 19 | 17-21 | 13 | 10-17 | 1 | 1-2 | 2 | 2-3 |
| Household income | ||||||||
| < $15,000 | 31 | 24-39 | NSR | NSR | 3 | 1-6 | 2 | 1-5 |
| $15,000 to $24,999 | 36 | 30-43 | 11 | 6-19 | 3 | 2-6 | 2 | 1-5 |
| $25,000 to $49,999 | 29 | 26-33 | 9 | 6-15 | 2 | 1-4 | 1 | 1-2 |
| $50,000 to $74,999 | 26 | 22-30 | 12 | 7-20 | 1 | 0-2 | 2 | 1-3 |
| $75,000+ | 21 | 19-23 | 13 | 9-19 | 1 | 1-2 | 3 | 2-4 |
| Race | ||||||||
| White, non-Hispanic | 24 | 22-25 | 11 | 9-14 | 1 | 1-2 | 2 | 1-2 |
| Black, non-Hispanic | 33 | 28-38 | 12 | 7-18 | 1 | 1-3 | 1 | 0-2 |
| Hispanic | 30 | 23-37 | NSR | NSR | 2 | 1-5 | 3 | 1-6 |
| Sexual orientation | ||||||||
| Lesbian, gay or bisexual | 26 | 20-33 | 7 | 3-18 | 5 | 3-8 | 4 | 2-9 |
| Straight | 25 | 23-27 | 12 | 10-14 | 1 | 1-2 | 2 | 1-2 |
*Excludes missing, don't know and refused
Note: If "NSR" is displayed, then the total response is less than 50 and/or the percentage prevalence is considered "not statistically reliable."
Used Any Prescription Paid Medications in the Past Year Prevalence per 1,000 Pennsylvania Population,
Pennsylvania Adults, 2017-2021
Color bands around estimates show 95% confidence intervals
Overweight and Obese, Pennsylvania Adults, 2021
| Overweight* (BMI 25-29) |
Obese* (BMI >= 30) |
Overweight & Obese* (BMI >= 25) |
||||
|---|---|---|---|---|---|---|
| Demographics | % | CI | % | CI | % | CI |
| All adults | 33 | 31-35 | 33 | 32-35 | 66 | 65-68 |
| Gender | ||||||
| Male | 37 | 34-39 | 34 | 32-36 | 71 | 68-73 |
| Female | 29 | 27-32 | 33 | 30-35 | 62 | 59-64 |
| Age | ||||||
| 18-29 | 25 | 21-29 | 23 | 19-26 | 48 | 43-52 |
| 30-44 | 31 | 28-34 | 34 | 31-38 | 65 | 61-69 |
| 45-64 | 34 | 32-37 | 41 | 38-44 | 75 | 73-78 |
| 65+ | 39 | 36-42 | 31 | 28-34 | 70 | 67-73 |
| Education | ||||||
| < High school | 27 | 20-34 | 34 | 27-42 | 61 | 52-69 |
| High school | 33 | 30-36 | 36 | 34-39 | 69 | 66-72 |
| Some college | 32 | 29-35 | 36 | 33-39 | 68 | 65-71 |
| College degree | 36 | 34-39 | 27 | 25-29 | 63 | 61-65 |
| Household income | ||||||
| < $15,000 | 26 | 19-35 | 41 | 33-49 | 67 | 59-75 |
| $15,000 to $24,999 | 32 | 26-38 | 37 | 32-44 | 69 | 66-72 |
| $25,000 to $49,999 | 30 | 26-33 | 37 | 33-40 | 66 | 62-70 |
| $50,000 tot $74,999 | 38 | 34-42 | 33 | 29-37 | 70 | 66-74 |
| $75,000+ | 35 | 32-38 | 32 | 30-35 | 68 | 65-70 |
| Race | ||||||
| White, non-Hispanic | 34 | 32-35 | 33 | 31-35 | 66 | 64-68 |
| Black, non-Hispanic | 29 | 25-34 | 45 | 40-50 | 74 | 70-78 |
| Hispanic | 36 | 29-43 | 34 | 27-42 | 70 | 62-77 |
| Sexual orientation | ||||||
| Lesbian, gay or bisexual | 25 | 19-31 | 28 | 22-34 | 52 | 44-60 |
| Straight | 34 | 32-35 | 34 | 32-36 | 67 | 65-69 |
*Excludes missing, don't know and refused
Note: The Body Mass Index (BMI), which describes relative weight for height, is significantly correlated with total body fat content. BMI is calculated as mass (kg)/height2 (m2) and estimated using pounds and inches by [weight (pound)/height2 (inches2)] x 703. Individuals with a BMI of 25 to 29.9 are considered overweight, while individuals with a BMI >= 30 are considered obese.
Overweight and Obese Prevalence per 1,000 Pennsylvania Population,
Pennsylvania Adults, 2011-2021
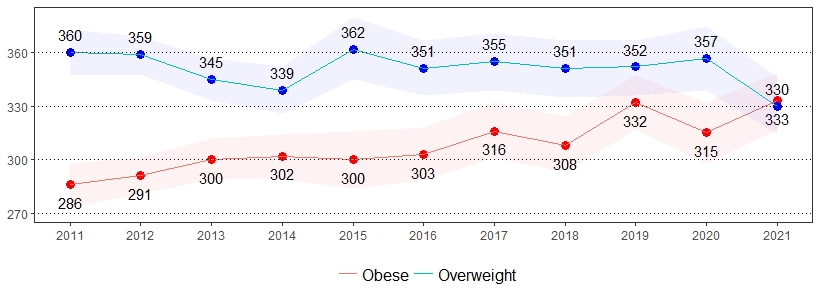
Color bands around estimates show 95% confidence intervals
Physical Impairments, Pennsylvania Adults, 2021
| Have Difficulty Making Decisions Due to Health Condition* ** |
Have Difficulty Walking or Climbing Stairs* |
Have Difficulty Dressing or Bathing* | Have Difficulty Doing Errands Alone Due to Health Condition* ** | |||||
|---|---|---|---|---|---|---|---|---|
| Demographics | % | CI | % | CI | % | CI | % | CI |
| All adults | 12 | 11-13 | 14 | 13-15 | 4 | 3-5 | 8 | 7-9 |
| Gender | ||||||||
| Male | 12 | 11-14 | 12 | 11-14 | 4 | 3-5 | 6 | 5-8 |
| Female | 11 | 10-13 | 15 | 13-17 | 4 | 3-5 | 9 | 8-10 |
| Age | ||||||||
| 18-29 | 17 | 14-21 | 4 | 2-6 | 1 | 1-2 | 8 | 6-10 |
| 30-44 | 11 | 9-14 | 6 | 4-7 | 2 | 1-3 | 5 | 4-6 |
| 45-64 | 10 | 9-12 | 16 | 14-18 | 6 | 4-7 | 7 | 6-9 |
| 65+ | 11 | 9-13 | 26 | 23-29 | 6 | 5-8 | 11 | 9-14 |
| Education | ||||||||
| < High school | 19 | 14-25 | 27 | 21-34 | 10 | 6-14 | 13 | 10-18 |
| High school | 15 | 13-18 | 16 | 14-18 | 5 | 4-6 | 10 | 8-12 |
| Some college | 12 | 10-14 | 14 | 12-16 | 4 | 3-5 | 8 | 6-10 |
| College degree | 6 | 5-7 | 6 | 5-7 | 1 | 1-2 | 3 | 2-4 |
| Household income | ||||||||
| < $15,000 | 25 | 19-33 | 39 | 31-47 | 16 | 11-23 | 27 | 20-35 |
| $15,000 to $24,999 | 25 | 20-31 | 32 | 27-38 | 9 | 6-12 | 21 | 16-26 |
| $25,000 to $49,999 | 14 | 12-17 | 18 | 16-21 | 6 | 4-8 | 9 | 7-12 |
| $50,000 to $74,999 | 7 | 5-9 | 12 | 10-15 | 3 | 2-5 | 4 | 3-6 |
| $75,000+ | 6 | 5-8 | 4 | 3-6 | 1 | 0-1 | 3 | 2-4 |
| Race | ||||||||
| White, non-Hispanic | 11 | 9-12 | 13 | 12-14 | 3 | 3-4 | 7 | 6-8 |
| Black, non-Hispanic | 14 | 11-18 | 18 | 15-22 | 6 | 4-9 | 12 | 9-16 |
| Hispanic | 20 | 15-27 | 15 | 11-20 | 4 | 2-8 | 7 | 4-11 |
| Sexual orientation | ||||||||
| Lesbian, gay or bisexual | 26 | 20-34 | 10 | 7-15 | 3 | 2-5 | 16 | 11-23 |
| Straight | 10 | 9-11 | 14 | 13-15 | 4 | 3-5 | 7 | 6-8 |
*Excludes missing, don't know and refused
**Includes physical, mental or emotional problems
Physical Impairments Prevalence per 1,000 Pennsylvania Population,
Pennsylvania Adults, 2013-2021
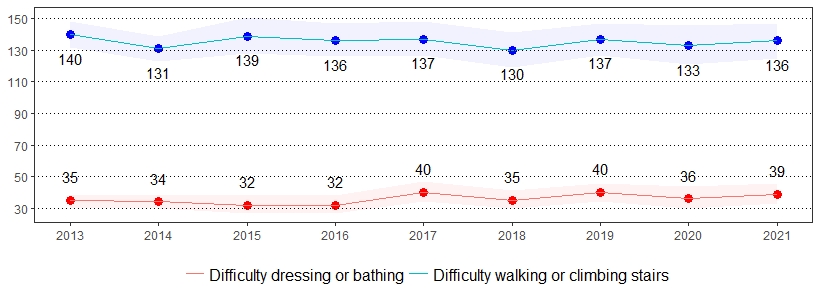
Color bands around estimates show 95% confidence intervals
Quality of Life, Pennsylvania Adults, 2021
| Physical Health Not Good 1+ Days in the Past Month* | Physical Health Not Good 14+ Days in the Past Month* | Mental Health Not Good 1+ Days in the Past Month* | Mental Health Not Good 14+ Days in the Past Month* | |||||
|---|---|---|---|---|---|---|---|---|
| Demographics | % | CI | % | CI | % | CI | % | CI |
| All adults | 32 | 30-33 | 12 | 11-13 | 39 | 37-40 | 14 | 13-15 |
| Gender | ||||||||
| Male | 30 | 28-32 | 11 | 10-13 | 34 | 32-36 | 12 | 11-14 |
| Female | 33 | 31-36 | 12 | 11-14 | 43 | 41-46 | 16 | 14-17 |
| Age | ||||||||
| 18-29 | 29 | 26-33 | 7 | 5-9 | 57 | 53-61 | 21 | 18-25 |
| 30-44 | 27 | 24-31 | 7 | 5-9 | 46 | 42-49 | 17 | 15-20 |
| 45-64 | 34 | 32-37 | 14 | 12-16 | 34 | 31-37 | 12 | 10-14 |
| 65+ | 36 | 33-39 | 17 | 15-20 | 25 | 23-28 | 9 | 7-11 |
| Education | ||||||||
| < High school | 35 | 28-43 | 20 | 15-27 | 31 | 24-38 | 17 | 12-23 |
| High school | 34 | 31-37 | 13 | 11-15 | 37 | 34-40 | 15 | 13-17 |
| Some college | 34 | 31-37 | 14 | 12-16 | 41 | 38-44 | 16 | 14-18 |
| College degree | 27 | 25-29 | 6 | 5-7 | 41 | 39-43 | 10 | 9-12 |
| Household income | ||||||||
| < $15,000 | 53 | 45-62 | 33 | 25-42 | 49 | 40-57 | 27 | 21-34 |
| $15,000 to $24,999 | 41 | 35-47 | 24 | 19-30 | 46 | 40-52 | 23 | 18-29 |
| $25,000 to $49,999 | 35 | 32-39 | 15 | 12-17 | 40 | 36-43 | 16 | 13-18 |
| $50,000 to $74,999 | 33 | 29-37 | 8 | 6-11 | 37 | 33-41 | 12 | 10-15 |
| $75,000+ | 26 | 23-28 | 6 | 5-8 | 39 | 36-41 | 10 | 8-12 |
| Race | ||||||||
| White, non-Hispanic | 32 | 30-34 | 11 | 10-13 | 38 | 36-40 | 13 | 12-15 |
| Black, non-Hispanic | 34 | 30-39 | 14 | 11-18 | 41 | 37-46 | 16 | 13-20 |
| Hispanic | 31 | 25-38 | 13 | 9-20 | 38 | 31-45 | 17 | 12-23 |
| Sexual orientation | ||||||||
| Lesbian, gay or bisexual | 44 | 37-52 | 13 | 9-19 | 70 | 62-76 | 35 | 28-42 |
| Straight | 30 | 29-32 | 11 | 10-13 | 36 | 34-38 | 12 | 11-13 |
*Excludes missing, don't know and refused
Poor Physical and Mental Health Prevalence per 1,000 Pennsylvania Population,
Pennsylvania Adults, 2011-2021
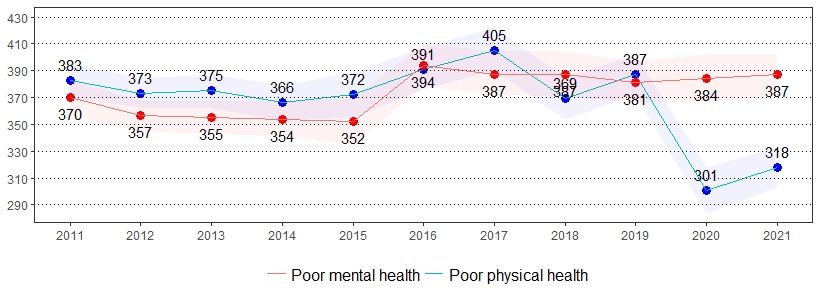
Color bands around estimates show 95% confidence intervals
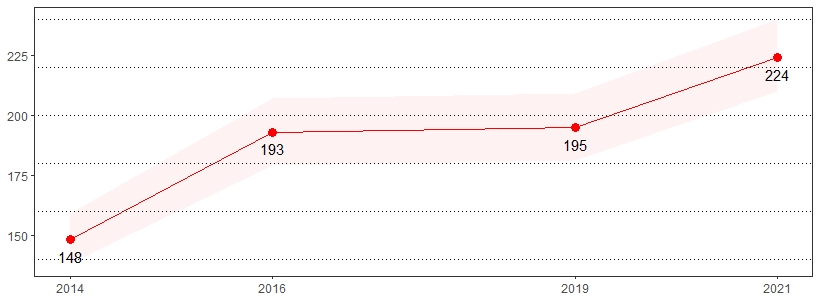
Sexual Orientation and Gender Identity, Pennsylvania Adults, 2021
| Considered to be Lesbian, Gay or Bisexual* | Considered to be Transgender* | |||
|---|---|---|---|---|
| Demographics | % | CI | % | CI |
| All adults | 5 | 5-6 | 1 | 0-1 |
| Gender | ||||
| Male | 5 | 4-6 | 1 | 0-1 |
| Female | 6 | 5-8 | 1 | 0-2 |
| Age | ||||
| 18-29 | 16 | 13-20 | 2 | 1-3 |
| 30-44 | 7 | 5-8 | 1 | 0-4 |
| 45-64 | 2 | 2-3 | 1 | 0-2 |
| 65+ | 1 | 1-2 | 0 | 0-0 |
| Education | ||||
| < High school | 4 | 2-8 | 3 | 1-12 |
| High school | 5 | 4-7 | 1 | 0-2 |
| Some college | 6 | 5-8 | 0 | 0-1 |
| College degree | 5 | 4-7 | 1 | 0-1 |
| Household income | ||||
| < $15,000 | 9 | 6-14 | 0 | 0-2 |
| $15,000 to $24,999 | 8 | 5-12 | 2 | 1-5 |
| $25,000 to $49,999 | 6 | 5-8 | 0 | 0-0 |
| $50,000 to $74,999 | 5 | 3-7 | 0 | 0-0 |
| $75,000+ | 4 | 3-5 | 2 | 1-4 |
| Race | ||||
| White, non-Hispanic | 5 | 4-6 | 0 | 0-1 |
| Black, non-Hispanic | 6 | 4-9 | 1 | 0-3 |
| Hispanic | 12 | 8-18 | NSR | NSR |
| Sexual orientation | ||||
| Lesbian, gay or bisexual | NSR | NSR | 3 | 1-6 |
| Straight | NSR | NSR | 0 | 0-1 |
*Excludes missing, don't know and refused
Note: If "NSR" is displayed, then the total response is less than 50 and/or the percentage prevalence is considered "not statistically reliable."
Sexual Orientation and Gender Identity Prevalence per 1,000 Pennsylvania Population,
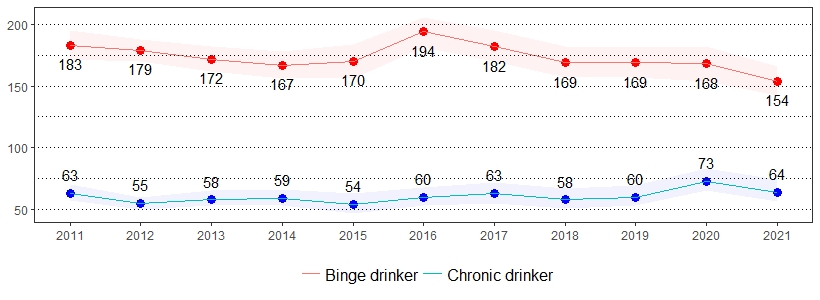
Pennsylvania Adults, 2014-2021
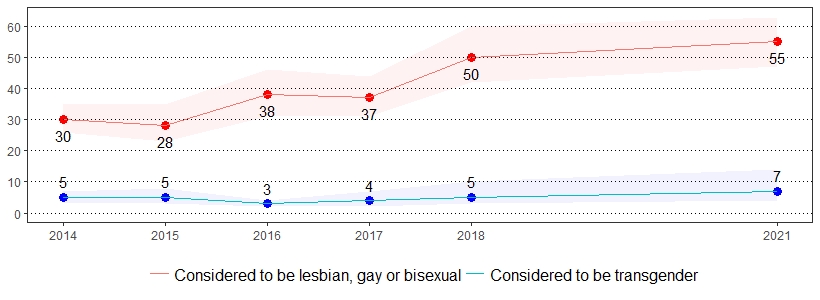
Color bands around estimates show 95% confidence intervals
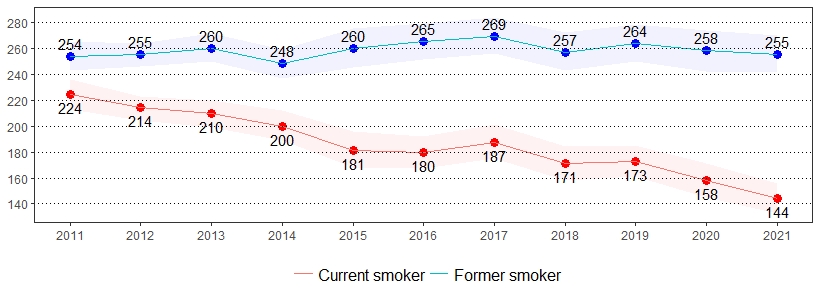
Tobacco Use, Pennsylvania Adults, 2021
| Current Smoker* ** | Currently Use Chewing Tobacco, Snuff or Snus* *** |
Former Smoker* | Never Smoker* | |||||
|---|---|---|---|---|---|---|---|---|
| Demographics | % | CI | % | CI | % | CI | % | CI |
| All adults | 14 | 13-16 | 4 | 3-4 | 26 | 24-27 | 60 | 58-62 |
| Gender | ||||||||
| Male | 15 | 14-17 | 6 | 5-8 | 28 | 26-30 | 57 | 54-59 |
| Female | 14 | 12-15 | 1 | 1-1 | 23 | 21-25 | 63 | 61-66 |
| Age | ||||||||
| 18-29 | 12 | 10-15 | 5 | 4-7 | 10 | 8-13 | 77 | 74-81 |
| 30-44 | 18 | 15-21 | 5 | 4-7 | 20 | 18-23 | 62 | 58-65 |
| 45-64 | 18 | 16-20 | 3 | 3-4 | 28 | 25-30 | 55 | 52-57 |
| 65+ | 9 | 8-11 | 1 | 1-2 | 39 | 36-43 | 51 | 48-54 |
| Education | ||||||||
| < High school | 24 | 18-31 | 3 | 1-5 | 25 | 19-33 | 50 | 42-58 |
| High school | 18 | 16-20 | 4 | 3-6 | 28 | 26-31 | 54 | 51-57 |
| Some college | 16 | 14-18 | 4 | 3-5 | 27 | 25-30 | 57 | 53-60 |
| College degree | 6 | 5-7 | 3 | 2-4 | 21 | 19-23 | 73 | 71-75 |
| Household income | ||||||||
| < $15,000 | 27 | 21-34 | 3 | 1-6 | 27 | 21-36 | 45 | 37-54 |
| $15,000 to $24,999 | 24 | 20-29 | 1 | 0-3 | 27 | 21-33 | 49 | 43-55 |
| $25,000 to $49,999 | 21 | 18-25 | 4 | 3-6 | 25 | 22-29 | 53 | 50-57 |
| $50,000 to $74,999 | 16 | 13-19 | 4 | 3-6 | 30 | 27-34 | 54 | 50-58 |
| $75,000+ | 8 | 7-10 | 3 | 2-4 | 25 | 23-28 | 67 | 64-69 |
| Race | ||||||||
| White, non-Hispanic | 15 | 13-16 | 4 | 3-5 | 28 | 26-30 | 57 | 55-59 |
| Black, non-Hispanic | 16 | 13-20 | 3 | 1-5 | 18 | 14-21 | 66 | 61-70 |
| Hispanic | 14 | 10-19 | 1 | 0-3 | 17 | 12-24 | 69 | 62-75 |
| Sexual orientation | ||||||||
| Lesbian, gay or bisexual | 21 | 16-28 | 2 | 1-7 | 19 | 14-25 | 60 | 52-67 |
| Straight | 15 | 13-16 | 4 | 3-5 | 26 | 25-28 | 59 | 57-61 |
*Excludes missing, don't know and refused
**Includes adults who smoke cigarettes every day or some days
***Includes adults who currently use chewing tobacco, snuff or snus every day or some days
Tobacco Use Prevalence per 1,000 Pennsylvania Population,
Pennsylvania Adults, 2011-2021